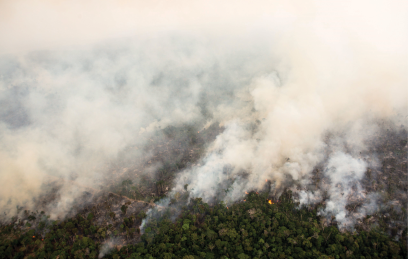
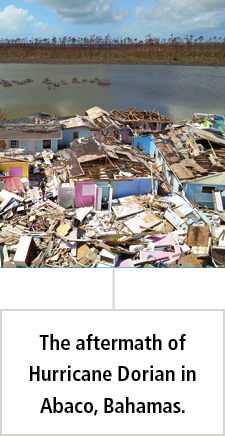
Heat waves and wildfires in the West, severe storms and tornadoes in the South, intense hurricanes along the coasts, and extreme rainfall and flooding in the Midwest and Great Plains. As more and more people personally experience severe and extreme weather events, they are increasingly likely to believe in climate change. Yet, many still deny or fail to understand how human activity, especially the burning of fossil fuels, is causing global warming and climate change. Thus, there is a need to educate today’s students, tomorrow’s leaders and decision makers, about global warming and climate change. It is, however, a challenging subject to teach. This is in part because: (1) climate change is an interdisciplinary subject; (2) it requires students to analyze scientific data and connect it to scientific models; (3) student learning is influenced by prior knowledge and experiences; and (4) it lacks a well-developed conceptual framework and learning progression.1
In this article, we outline five critical topics about global warming and climate change that secondary students should learn and that every adult should understand: (1) weather, climate, and climate change; (2) the earth’s climate system; (3) the earth’s energy budget and the greenhouse effect; (4) energy use and carbon emissions; and (5) climate change debate or not. For each, we articulate key concepts and provide some pedagogical suggestions in an attempt to promote the teaching and learning of global warming and climate change. But first, let’s review the science and what students know.
Global Warming and Climate Change
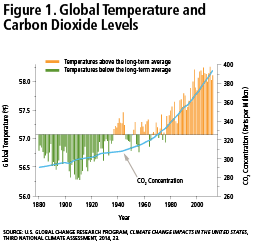
The scientific community agrees that the earth is warming and that this is due to human activity, primarily the burning of fossil fuels (coal, oil, and natural gas), which alters the atmospheric composition of greenhouse gases.2 Greenhouse gas emissions, particularly carbon dioxide (CO₂), from energy use has increased global atmospheric concentrations of CO₂ to historic levels, 412 parts per million.3 This, in turn, has resulted in an increase in global radiative forcing, causing the earth’s average surface temperature to increase by about 1.6 degrees Fahrenheit since the late 19th century (see Figure 1). This global warming has caused regional changes in temperature, precipitation, and extreme weather events.4 In other words, the earth’s climates are changing. Natural climate variations alone, whether due to changes in the sun’s radiance, the earth’s orbit, or volcanic eruptions, cannot account for the degree of warming measured over the last 50 years. A changing climate impacts the earth’s oceans, snow and ice, and ecosystems.5 For example:
- Oceans are warmer, more acidic, and rising;
- Arctic sea ice and glaciers are melting;
- Snow cover and snowpack has declined; and
- Growing season length, insect infestations, and bird migrations have changed.6
(click image to expand)
Furthermore, climate change will likely have human health and socioeconomic consequences.7
We should note that global warming and climate change are two distinct phenomena that are closely linked. Global warming refers to the measured increase in the global average temperature of the earth, and this warming is causing the earth’s climates to change. Climate change is the statistically significant change in the atmospheric conditions due to human activity, of which global warming is one factor.*
Students’ Understanding of Global Warming and Climate Change
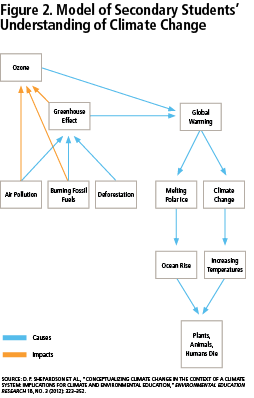
From our reviews of the research on secondary students’ understanding of global warming and climate change, we developed a general model of students’ understanding, as shown in Figure 2. We should note that some students think the greenhouse effect and global warming are the same, and that some students think the greenhouse effect is caused by humans. Our work and the research of others have also shown that secondary students lack an understanding of:
- The relationship between the biogeochemical cycles, the greenhouse effect, and the earth’s energy budget;8
- The impact of the greenhouse effect on global warming and its effect on the climate;9 and
- The impact of climate change on the earth’s spheres or components (e.g., oceans, weather, animal and plant distributions/diversity, and land).10
(click image to expand)
Our review of science textbooks and laboratory manuals found that many isolate or separate the climate from climate change, and that few foster students’ conceptual understanding about global warming and climate change. In fact, some may promote misconceptions about the greenhouse effect.11 Science textbooks may also be promoting doubt about the scientific conclusion that recent changes in the climate are primarily driven by human activity. An analysis12 of several middle school science textbooks found that the textbooks’ grammatical choices expressed uncertainty about whether climate change was happening at all and about whether humans were responsible. Thus, textbooks add to the challenge of teaching students about global warming and climate change.
The Five Critical Topics Every Student Should Understand
1. Weather, Climate, and Climate Change
Many students struggle to understand the relationship between weather and climate, and the related concept of climate change. Therefore, it is important that students first learn about weather and then investigate weather events in the context of climate data to learn about climate change. The difference between weather and climate is a matter of scale. Weather is the short-term (hours, days, weeks) conditions of the atmosphere described in terms of temperature, precipitation, humidity, wind, cloudiness, visibility, and air pressure. Weather is inherently variable, changing from day to day and season to season, with atmospheric conditions fluctuating naturally within a given range for a specific time and place.
Climate is the average of this variability in weather for a 30-year or longer time period. It is the “smoothing” of the variation in weather. While the “average” climate is most often talked about, long-term climate data also help us describe the range of expected conditions for a location, the frequency of extreme weather, and the likelihood of certain types of weather events. Climate data are essential for understanding patterns, trends, and changes in our long-term climate. To reiterate, climate change is the statistically significant change in atmospheric conditions due to human activity.
One of the challenges in teaching about climate change is that it cannot be directly experienced or measured in the timescale of a classroom lesson. Students can measure the daily weather or an extreme weather event, but what they are observing might be climate change or it might be natural variability in the atmosphere. Comparing weather data to climate data helps us put the weather in context, but attributing a weather event to climate change is difficult. There is an entire field of climate science research that explores extreme weather event attribution to climate change. Still, comparing weather and climate data, students can begin to understand the connection between extreme weather events and climate change, on a basic level, by exploring the patterns and trends in past climate data.
To teach about weather and climate, teachers might have students collect daily temperature and precipitation data for a period of time and then compare that data to the National Oceanic and Atmospheric Administration’s (NOAA) climate data for the United States or their region or state. Teachers and students may access this data at NOAA’s “Climate at a Glance” web page: www.ncdc.noaa.gov/cag. Here, teachers and students can manipulate and analyze a variety of climate data (e.g., temperature, precipitation, cooling and heating degree days, and drought indices).
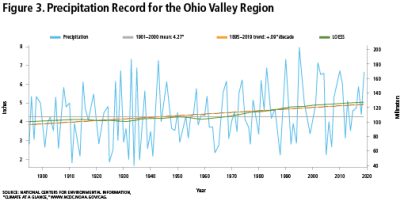
For example, given the extreme precipitation events that occurred this spring, we were interested in comparing May 2019 precipitation with climate data for the Ohio Valley region. Using the online tool, we generated a time series graph for the month of May starting with 1895 and ending in 2019 (see Figure 3), but we could have selected any time period, as long as it was 30 years or more, and any location in the United States. The tool is easy to use, and with the online version, you can zoom in and out on the graph, making it easier to interpret, and you can download the raw data, which is also shown online. Interpreting the graph, we can see that May 2019 precipitation was above the average (normal) for the time period identified and is in line with the increasing precipitation trend over the last century. Students can also see the year-to-year variability in precipitation; that is, some Mays are wetter and others drier, but overall May precipitation is increasing in the Ohio Valley region.
(click image to expand)
Teachers and students may also use climate data to answer questions they might have about the climate and climate change. For example, students might want to know if other U.S. regions experienced the same extreme May precipitation as the Ohio Valley region, and, if so, if there is an increasing trend in precipitation for those regions. Or students might want to know how May precipitation for the Ohio Valley region has changed over time periods, generating a series of 30-year time period graphs (e.g., 1899–1929, 1929–1959, 1959–1989, and 1989–2019). In this way, students are engaging in more authentic science by asking their own questions about the climate and climate change and by using “real” data to answer their questions.
If teachers lack classroom computers, they could generate data sets from the website for students to analyze on paper. These approaches to learning about weather, climate, and climate change are aligned with the Next Generation Science Standards (NGSS),13 which stress the importance of student engagement in science practices: asking questions, analyzing and interpreting data, constructing explanations, and evaluating and communicating information.
2. Earth’s Climate System
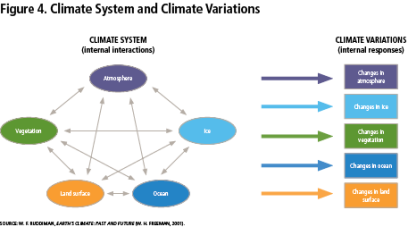
The climate of any given region on earth is determined by the climate system, which consists of five components: atmosphere, oceans, land, vegetation (life), and ice (as shown in Figure 4). A change in a region’s climate system results in a change in that region’s climate. A climate-literate individual understands how humans influence the earth’s climate system, and vice versa.14 At the same time, the NGSS15 stress the importance of science instruction that engages students in analyzing, modeling, and thinking about systems in terms of their components and interactions. Therefore, it is important that students learn about the earth’s climate system and use a conceptual model of the earth’s climate system (e.g., Figure 4) as a tool for thinking about the climate and climate change. This approach focuses on looking at the components of the climate system (atmosphere, oceans, land, vegetation, and ice) and how they interact, going beyond simple cause-and-effect relationships, to think in terms of interdependence and feedbacks.
(click image to expand)
By using such an approach, students can diagram the movement of matter (e.g., CO₂) and the transfer of energy within and between components and “trace” the path of CO₂ and the sun’s energy through the system, component by component. Students can use the conceptual model to answer questions and solve problems about the climate and climate change. For example: How would a warming ocean impact the climate system and climate? How might deforestation impact them? How does carbon move through the climate system, and how might that impact the system and climate?
We have found success in eliciting students’ ideas about the climate system by having them draw a climate system, label its parts, and explain their drawing. Students, in small groups, then share their drawings and explanations, discussing the similarities and differences. Next, students use a conceptual model (diagram) of the earth’s climate system to compare and contrast their drawings (ideas) to the conceptual model. Again, they discuss the similarities and differences between their ideas and the conceptual model. As a result, the conceptual model becomes a tool that students use to reflect on their ideas and to think about the earth’s climate system. Alternatively, teachers could have students in small groups create a climate system poster that is tacked to a display board and shared with the class and compared to the conceptual model.
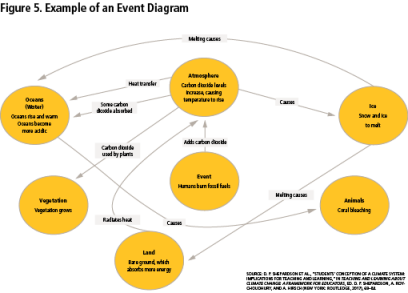
Another tool to engage students is having them draw an event diagram, which is a means for thinking about the interactions between and among components of the climate system (see Figure 5). For example, students use the event diagram to think through how the burning of fossil fuels impacts the climate system. Students connect the various components as needed, identifying relationships, feedbacks, and interactions among components, thinking spatially and temporally. The event diagram scaffolds their thinking and makes their thinking visible.
(click image to expand)
Teachers might want to use a physical model of the climate system to demonstrate how different earth surfaces (e.g., ice, water, vegetation, and land) absorb and reflect sunlight (albedo), and then compare the demonstration to the climate system diagram. Teachers could model the climate system by using different colored sheets of construction paper to represent the different components of the climate system (e.g., white = snow/ice/clouds, green = vegetation, blue = water/oceans, and brown = land; note: black could be used to represent asphalt and gray concrete).
To conduct the demonstration, place the different colored sheets of construction paper on a table under a light source. Using a light meter, measure the incoming light and then turn the light meter face down and measure the reflected light from each colored piece of construction paper. To determine the albedo of each colored paper, divide the reflected light reading by the incoming light reading. Surfaces with high albedo are reflecting more of the light energy, whereas surfaces with lower albedo are absorbing more of the light energy. Therefore, surfaces with high albedo will have lower temperatures than surfaces with low albedo. Surfaces with low albedo will be warmer and emit (radiate) more heat (infrared radiation).
Next, discuss with students how changes in the earth’s components (different colored paper) might impact the earth’s climate system. Changes in vegetation, land cover, or ice would impact albedo, increasing or decreasing the earth’s temperature. For example, as polar snow and ice melt (white), more water (blue) and land (brown) are exposed to solar radiation. Because water and land have lower albedos than the snow and ice that melted, they reflect less and absorb more solar radiation, causing the earth to warm. The point here is that the earth’s temperature may be changed by changing the earth’s surface, which impacts the earth’s albedo. Global warming is not restricted to changes in greenhouse gases; changes in albedo also impact global warming.
These approaches address what researchers16 have identified from a review of the literature as key characteristics of systems thinking:
- The ability to identify the components and processes of the system;
- The ability to identify simple relationships between and among the components of the system;
- The ability to identify dynamic relationships within the system;
- The ability to organize the components, processes, and interactions of the system within a framework of relationships;
- The ability to identify the cyclic nature of the system;
- The ability to understand patterns and relationships within the system;
- The ability to generalize based on an understanding of the system; and
- The ability to think temporally, to think in terms of the past, present, and future.
As teachers develop and incorporate lessons and activities, they should integrate these eight aspects of systems thinking. By embedding them into the teaching of global warming and climate change, students would better understand how climate change is a result of a change to the climate system, how the components of the climate system interact to determine the climate, and how changing one component of the system impacts other components of the system.
3. Earth’s Energy Budget and the Greenhouse Effect
The greenhouse effect is the driver of global warming, which causes the earth’s climate to change. Thus, understanding the greenhouse effect is a key principle of climate literacy.17 At the same time, it is difficult and challenging to teach students about the greenhouse effect.18 Secondary students generally hold one of five mental models of the greenhouse effect that influences their thinking and learning (see the box below).
As a side note, we have informally assessed university students and found similar mental models, with the exception of Model 1. In addition, some students believe that the greenhouse effect is caused by humans, equating global warming to the greenhouse effect. To clarify, the greenhouse effect is a natural atmospheric phenomenon that warms the earth’s surface (see Figure 6). Human activities such as the burning of fossil fuels and deforestation (land surface changes) add extra greenhouse gases, particularly CO₂, to the atmosphere, increasing the warming effect, causing global warming. This is often referred to as the enhanced greenhouse effect.
(click image to expand)
Although the emphasis here is on teaching the greenhouse effect, we recommend that teachers start by teaching about the earth’s energy budget, of which the greenhouse effect is a component. By doing so, we believe that students can develop a richer understanding of the physics of the greenhouse effect: the absorption, reflection, and radiation of the sun’s energy, and the differentiation between solar radiation and terrestrial radiation.
The common textbook activity used to teach students about the greenhouse effect is to have students set up a physical model. In general, this investigation requires students to set up two glass jars, one with a lid, and place a thermometer in each jar. They then expose the jars to a light source and record the temperature of the jars over time. The students describe their observations and explain their data, learning how the greenhouse effect traps heat and warms the air over time.
However, we19 and others20 have been critical of this physical model because of its limitations. For instance, this approach models a “greenhouse,” not the “greenhouse effect.” The critical difference is that in a greenhouse, the glass prevents the warmed inside air from mixing with the cooler outside air, preventing heat transfer or convection, thus warming the greenhouse. (Note: this is similar to why your car’s interior heats up when parked in the sun.) This warming is due to the suppression of heat transfer by convection, versus radiative forcing that occurs in the greenhouse effect. We believe this physical model reinforces students’ misunderstandings as represented in mental Models 1 (greenhouse) and 4 (heat-trapping).
Our suggestion for teachers who wish to use this physical model to teach the greenhouse effect is to engage students in using a conceptual model (as shown in Figure 6) of the earth’s energy budget and greenhouse effect to discuss the limitations of the physical model. Teachers should engage students in identifying the ways that the physical model did and did not match the conceptual model.
Additionally, we suggest that teachers elicit students’ ideas by having them draw a picture of the greenhouse effect and label and explain their drawing. In small groups, students then share their drawings and explanations, discussing the similarities and differences. The teacher might even post the drawings on the board to facilitate a class discussion. Students then use a conceptual model of the earth’s energy budget and greenhouse effect to compare and contrast their drawings and ideas (mental models) to the conceptual model. Again, they discuss the similarities and differences between their ideas and the conceptual model. The conceptual model becomes a tool that students use to reflect on their ideas and to think about the earth’s energy budget and the physical model.
Alternatives to the physical model of the greenhouse effect are two excellent PhET (Physics Education Technology) computer models or simulations from the University of Colorado. One (available here) simulates the interaction of light with matter, while the other (available here) simulates the effect of greenhouse gas concentration in the atmosphere on temperature through the absorption and emission of infrared radiation. Again, students should use a conceptual model of the earth’s energy budget to explain how the computer models reflect the conceptual model.
One final point we would like to make is the importance of the language used to talk about the physical and conceptual models and student drawings (mental models). Students’ initial ideas will likely reflect “everyday” language like “trapping heat” or “heat is trapped” or “light or heat bounces.” This everyday language is a necessary first step to understanding the greenhouse effect; however, it is important to eventually differentiate and link this everyday language to the scientific ideas of absorption and emission or radiation of energy. The continued use of everyday language versus scientific language essentially reinforces or develops misunderstandings, such as the heat-trapping mental model.
4. Energy Use and Carbon Emissions
When it comes down to it, human-driven climate change is really an energy problem. The use of fossil fuels as an energy source results in the emission of CO₂ into the atmosphere. As previously mentioned, CO₂ is the key driver of global warming and climate change. Thus, to mitigate global warming, we must address our use of fossil fuels. We must understand how carbon is moved through the earth’s climate system, how exactly we use fossil fuels, and what specifically are the major emitters, or sources, of CO₂.
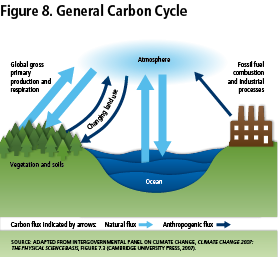
The atmospheric concentration of CO₂ is regulated by the global carbon cycle, the movement of carbon between the components of the climate system. Although this movement or flux of CO₂ is dominated by natural processes that cycle carbon between the atmosphere, land, vegetation, and oceans, human use of fossil fuels adds “extra” CO₂ to the atmosphere. This human-emitted CO₂ exceeds nature’s capacity to absorb it, and as a result, atmospheric concentrations have increased over time.
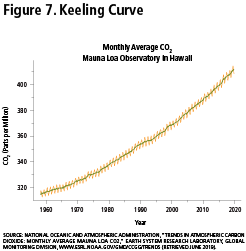
The now-famous Keeling curve, a graph of the accumulation of carbon dioxide in the earth’s atmosphere, shows this increase in atmospheric CO₂ levels (see Figure 7). When we burn fossil fuels, we release stored carbon into the atmosphere as part of the carbon cycle. Much of this carbon is stored in the atmosphere, where it may remain for 100 years, but some moves between the atmosphere, oceans, vegetation, and land. The atmospheric concentration of CO₂ has increased by about 40 percent since the 1800s.21 (For the general movement of carbon, see Figure 8.)
(click image to expand)
One activity that simulates the movement of carbon and how human activity has impacted the global carbon cycle is “The Carbon Cycle, Then and Now,” created by the Peggy Notebaert Nature Museum in Chicago. In this activity, students learn about the carbon cycle by becoming carbon atoms and moving to various stations that represent the components of the carbon cycle. Students complete the activity twice, once as carbon atoms prior to industrialization and once as postindustrialized carbon atoms. It is helpful to link this activity to the conceptual models of the carbon cycle and the earth’s climate system by having students trace the movement of carbon through the conceptual models.
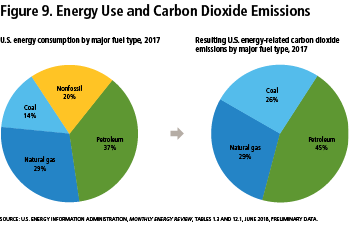
In 2016, fossil fuels provided about 81 percent of the energy used in the United States, and accounted for about 94 percent of CO₂ emissions.22 A number of activities engage students in using carbon footprint calculators to help them determine their own carbon contributions to global warming and to engage them in thinking about the decisions they make and how they might personally reduce their carbon emissions. Although this is an important activity for students to learn about their carbon footprint, we agree with researchers23 who contend that students must also understand the social, political, and economic aspects of energy use and carbon emissions—the big picture, if you will.
While individual action is important, it is likely that the solution to global warming will only be achieved at the policy level—through government action. Such action will likely be driven by individuals through economic and political activity. And this requires that students have a firm understanding of energy use and carbon emission data in order to make evidence-based arguments for policy change.
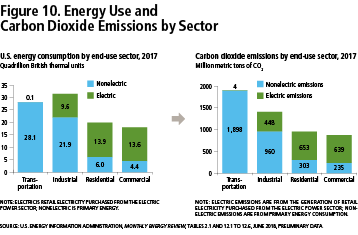
To help students understand how we use energy and emit CO₂ into the atmosphere, we suggest that students analyze energy and CO₂ emission data. Teachers and students may access this data from the U.S. Energy Information Administration’s website: www.eia.gov. By investigating these data, students can learn about the relationship between fossil fuel use and CO₂ emissions (as shown in Figure 9), energy use and CO₂ emissions by sector (as shown in Figure 10), and other energy use data. Using this information, students can make data-based policy recommendations that aim to reduce carbon emissions at the regional, state, and national levels. Through this process, students consider the pros and cons of their policy decisions, and they consider how energy prices, weather, and current government policy might impact energy use and carbon emissions. The key here is that students are engaged with analyzing and explaining data in order to make evidence-based policy decisions or arguments.
(click image to expand)
For sample classroom activities on energy use and CO₂ emissions, teachers can review the “Activities for Conceptualizing Climate and Climate Change” found on the Purdue Climate Change Research Center’s website. Secondary science teachers interested in a comprehensive curriculum that emphasizes the carbon cycle may want to review “Carbon TIME (Transformations in Matter and Energy),” a program funded by the National Science Foundation and led by Michigan State University.
5. Climate Change Debate or Not
Unfortunately, climate change doubters and deniers provide challenges to educators who teach about climate change, influencing how teachers present climate change in ways that compromise the scientific accuracy of their lessons. Researchers24 found that some teachers, with good intentions, teach climate change in three inappropriate ways. One approach is to teach both the scientific perspective on climate change and the skeptics’ perspective on climate change. But doing so suggests there is not a scientific consensus on the cause of climate change, and it gives credibility to perspectives that are not supported by the scientific community and climate data. A second approach is to encourage students to come to their own conclusion about the cause of global warming and climate change. And the third approach is to engage students in debating climate change. These approaches promote doubt and denial about climate change and suggest that it is a scientific controversy, which it is not. They also contradict the scientific community and the climate data and give credibility to science skeptics and their nonscientific data.
Given the scientific consensus on the cause of global warming and climate change, teachers should teach the scientifically accepted perspective on global warming and climate change—not debate it. The debate and controversy lie in the social, economic, and political approaches to mitigating and adapting to global warming and climate change. Teachers can engage students in debating these various approaches and solutions to climate change and making policy decisions about energy use.
Teaching and learning about global warming and climate change is not easy. Students cannot directly monitor climate change due to time and spatial scale issues. Thus, in order to learn about climate change, it is necessary for them to interpret, analyze, explain, and evaluate climate data, model-based data projections, and conceptual models. Students need opportunities to think systematically about the earth’s energy budget, climate system, and climate change. They need opportunities to investigate and consider energy use and carbon emission data. And it is important that students be given the opportunity to make informed decisions concerning their own personal actions and behaviors, as well as those of the societies in which they live.
Although we provided several examples of classroom activities, it is essential that teachers design a curriculum that is coherent, that reflects continuity, that builds from students’ ideas and experiences, and that aligns with the scientific consensus. Thus, the time needed to teach about global warming and climate change and the curricular constraints and educational policies related to these topics further complicate such teaching. However, schools, school districts, state superintendents, and politicians must come to realize the impact of climate change and support the teaching of global warming and climate change for the betterment of our students and the future of our planet.
Daniel P. Shepardson is a professor of geoenvironmental and science education in the Department of Curriculum and Instruction and the Department of Earth, Atmospheric, and Planetary Sciences at Purdue University. Andrew S. Hirsch is a professor of physics in the Department of Physics and Astronomy at Purdue University. This article draws from sections of Teaching and Learning about Climate Change: A Framework for Educators (Routledge, 2017), edited by Shepardson, Anita Roychoudhury, and Hirsch.
*For more on climate change data, visit https://science2017.globalchange.gov and https://nca2018.globalchange.gov. (back to article)
Endnotes
1. W. R. Johnson and C. W. Anderson, “Unpacking the Climate Change Performance Expectations in the Next Generation Science Standards,” in Teaching and Learning about Climate Change: A Framework for Educators, ed. D. P. Shepardson, A. Roychoudhury, and A. S. Hirsch (New York: Routledge, 2017), 106–119; D. P. Shepardson et al., “Conceptualizing Climate Change in the Context of a Climate System: Implications for Climate and Environmental Education,” Education Research 18, no. 3 (2012): 323–352; D. P. Shepardson et al., “When the Atmosphere Warms It Rains and Ice Melts: Seventh Grade Students’ Conceptions of a Climate System,” Environmental Education Research 20, no. 3 (2014): 333–353; and D. P. Shepardson et al., “Students’ Conception of a Climate System: Implications for Teaching and Learning,” in Teaching and Learning about Climate Change: A Framework for Educators, ed. D. P. Shepardson, A. Roychoudhury, and A. S. Hirsch (New York: Routledge, 2017), 69–84.
2. Intergovernmental Panel on Climate Change, Climate Change 2013: The Physical Science Basis, ed. T. F. Stocker et al. (Cambridge, UK: Cambridge University Press, 2013); U.S. Global Change Research Program, Climate Science Special Report, Fourth National Climate Assessment, Volume I (Washington, DC: 2017); and U.S. Global Change Research Program, Impacts, Risks, and Adaptation in the United States, Fourth National Climate Assessment, Volume II (Washington, DC: 2018).
3. NASA, “Global Climate Change: Vital Signs of the Planet,” https://climate.nasa.gov.
4. U.S. Global Change Research Program, Fourth National Climate Assessment, Volumes I and II; Energy Information Administration, “Energy Explained: Your Guide to Understanding Energy,” 2018, www.eia.gov/energyexplained/index.php; and Environmental Protection Agency, Climate Change Indicators in the United States, 2012 (Washington, DC: EPA, 2012).
5. Environmental Protection Agency, Climate Change Indicators; Energy Information Administration, “Energy Explained”; Intergovernmental Panel on Climate Change, Climate Change 2013; and U.S. Global Change Research Program, Fourth National Climate Assessment, Volumes I and II.
6. Environmental Protection Agency, Climate Change Indicators; Intergovernmental Panel on Climate Change, Climate Change 2013; and U.S. Global Change Research Program, Fourth National Climate Assessment, Volumes I and II.
7. U.S. Climate Change Science Program and Subcommittee on Global Change Research, Analyses of the Effects of Global Change on Human Health and Welfare and Human Systems, Final Report, Synthesis and Assessment Product 4.6 (U.S. Environmental Protection Agency, 2008); Environmental Protection Agency, Climate Change Indicators; Intergovernmental Panel on Climate Change, Climate Change 2013; and U.S. Global Change Research Program, Fourth National Climate Assessment, Volumes I and II.
8. E. Boyes and M. Stanisstreet, “The Greenhouse Effect—Children’s Perception of Causes, Consequences, and Cures,” International Journal of Science Education 15, no. 5 (1993): 531–552; B. Fisher, “Australian Students’ Appreciation of the Greenhouse Effect and the Ozone Hole,” Australian Science Journal 44, no. 33 (1998): 46–55; and D. P. Shepardson et al., “Seventh Grade Students’ Conceptions of Global Warming and Climate Change,” Environmental Education Research 15, no. 5 (2009): 549–570.
9. Fisher, “Australian Students’ Appreciation”; M. V. R. Gowda, J. C. Fox, and R. D. Magelky, “Students’ Understanding of Climate Change: Insights for Scientists and Educators,” Bulletin of the American Meteorological Society 78, no. 1 (1997): 2232–2240; D. Pruneau et al., “Experimentation with a Socio-Constructivist Process for Climate Change Education,” Environmental Education Research 9, no. 4 (2003): 429–446; and Shepardson et al., “Seventh Grade Students’ Conceptions of Global Warming.”
10. Boyes and Stanisstreet, “The Greenhouse Effect”; A. Kilinc, M. Stanisstreet, and E. Boyes, “Turkish Students’ Ideas about Global Warming,” International Journal of Environmental & Science Education 3, no. 2 (2008): 89–98; and Shepardson et al., “Seventh Grade Students’ Conceptions of Global Warming.”
11. S. Choi et al., “Do Earth and Environmental Science Textbooks Promote Middle and High School Students’ Conceptual Development about Climate Change?: Textbooks’ Consideration of Students’ Conceptions,” Bulletin of the American Meteorological Society (July 2010): 889–898; and Shepardson et al., “Seventh Grade Students’ Conceptions of Global Warming.”
12. D. Román and K. Busch, “Textbooks of Doubt: Using Systemic Functional Analysis to Explore the Framing of Climate Change in Middle-School Science Textbooks,” Environmental Education Research 22, no. 8 (2016): 1158–1180.
13. National Research Council, A Framework for K–12 Science Education: Practices, Crosscutting Concepts, and Core Ideas (Washington, DC: National Academy Press, 2012).
14. U.S. Global Change Research Program, Climate Literacy: The Essential Principles of Climate Science, March 2009.
15. National Research Council, A Framework.
16. O. Ben-Zvi Assaraf and N. Orion, “Development of System Thinking Skills in the Context of Earth System Education,” Journal of Research in Science Teaching 42, no. 5 (2005): 518–560.
17. U.S. Global Change Research Program, Climate Literacy.
18. D. P. Shepardson et al., “Seventh Grade Students’ Mental Models of the Greenhouse Effect,” Environmental Education Research 17, no. 1 (2011): 1–17; M. McCaffrey and S. M. Buhr, “Clarifying Climate Confusion: Addressing Systemic Holes, Cognitive Gaps, and Misconceptions through Climate Literacy,” Physical Geography 29, no. 6 (2008): 512–528; and L.-A. L. Dupigny-Giroux, “Exploring the Challenges of Climate Science Literacy: Lessons from Students, Teachers, and Lifelong Learners,” Geography Compass 4, no. 9 (2010): 1203–1217.
19. Shepardson et al., “Seventh Grade Students’ Mental Models.”
20. For example, see P. Wagoner, C. Liu, and R. G. Tobin, “Climate Change in a Shoebox: Right Result, Wrong Physics,” American Journal of Physics 78 (2010): 536–540.
21. Energy Information Administration, “Energy Explained.”
22. Energy Information Administration, “Energy Explained.”
23. H. K. Miller and C. W. Anderson, “Using NGSS Crosscutting Concepts as a Tool for Climate Change and Citizenship Education,” in Teaching and Learning about Climate Change: A Framework for Educators, ed. D. P. Shepardson, A. Roychoudhury, and A. S. Hirsch (New York: Routledge, 2017), 181–193.
24. M. Berbecco, K. Hefferman, and G. Branch, “Doubt and Denial as Challenges to, and in, Teaching Climate Change,” in Teaching and Learning about Climate Change: A Framework for Educators, ed. D. P. Shepardson, A. Roychoudhury, and A. S. Hirsch (New York: Routledge, 2017), 235–245; and M. Berbeco et al., “Choose Controversies Wisely,” Science Teacher 81, no. 4 (2014): 8–9.
Photo Credits, top to bottom:
1.ZUMA Press Inc./Alamy Stock Photo
2. AP Photo/Ramon Espinosa
3. U.S. Department of Agriculture Photo by Bob Nichols
4. Allstar Picture Library/Alamy Stock Photo
5. Nature Picture Library/Alamy Stock Photo

